Arcticterntalk.org

The blog of a travelling psychiatrist and football lover. Who happens to be a halfway decent photographer. Takes a cynical view of the world

Author Archive

A few hours somewhere in the Rome suburbs in early May


It is early May and the weather is surprisingly warm. I am somewhere in the Rome suburbs for a meeting this evening . This gives me the chance to just walk around for an hour or two. 

First impressions are that few speak English and chaos reigns. Smoke is everywhere in the usual Latin way and folks amble along down the streets with no evidence of speed.  The buildings are mostly old and not so well kept. Even some of the buildings give the impression of smoking with wisps of white cloud above them. 

A few pizza restaurants are open along the main streets. But a pleasant place to stroll around in the sunshine. Avoiding the cars is the most important thing as they drive and park seemingly everywhere.  Curiously I did see one car with what I imagined to be a parking ticket. It was the only car parked seemingly in a proper place! Cars parked on pedestrian crossings were not unusual 


All the offices and houses have entry systems that look like they are some random game. 

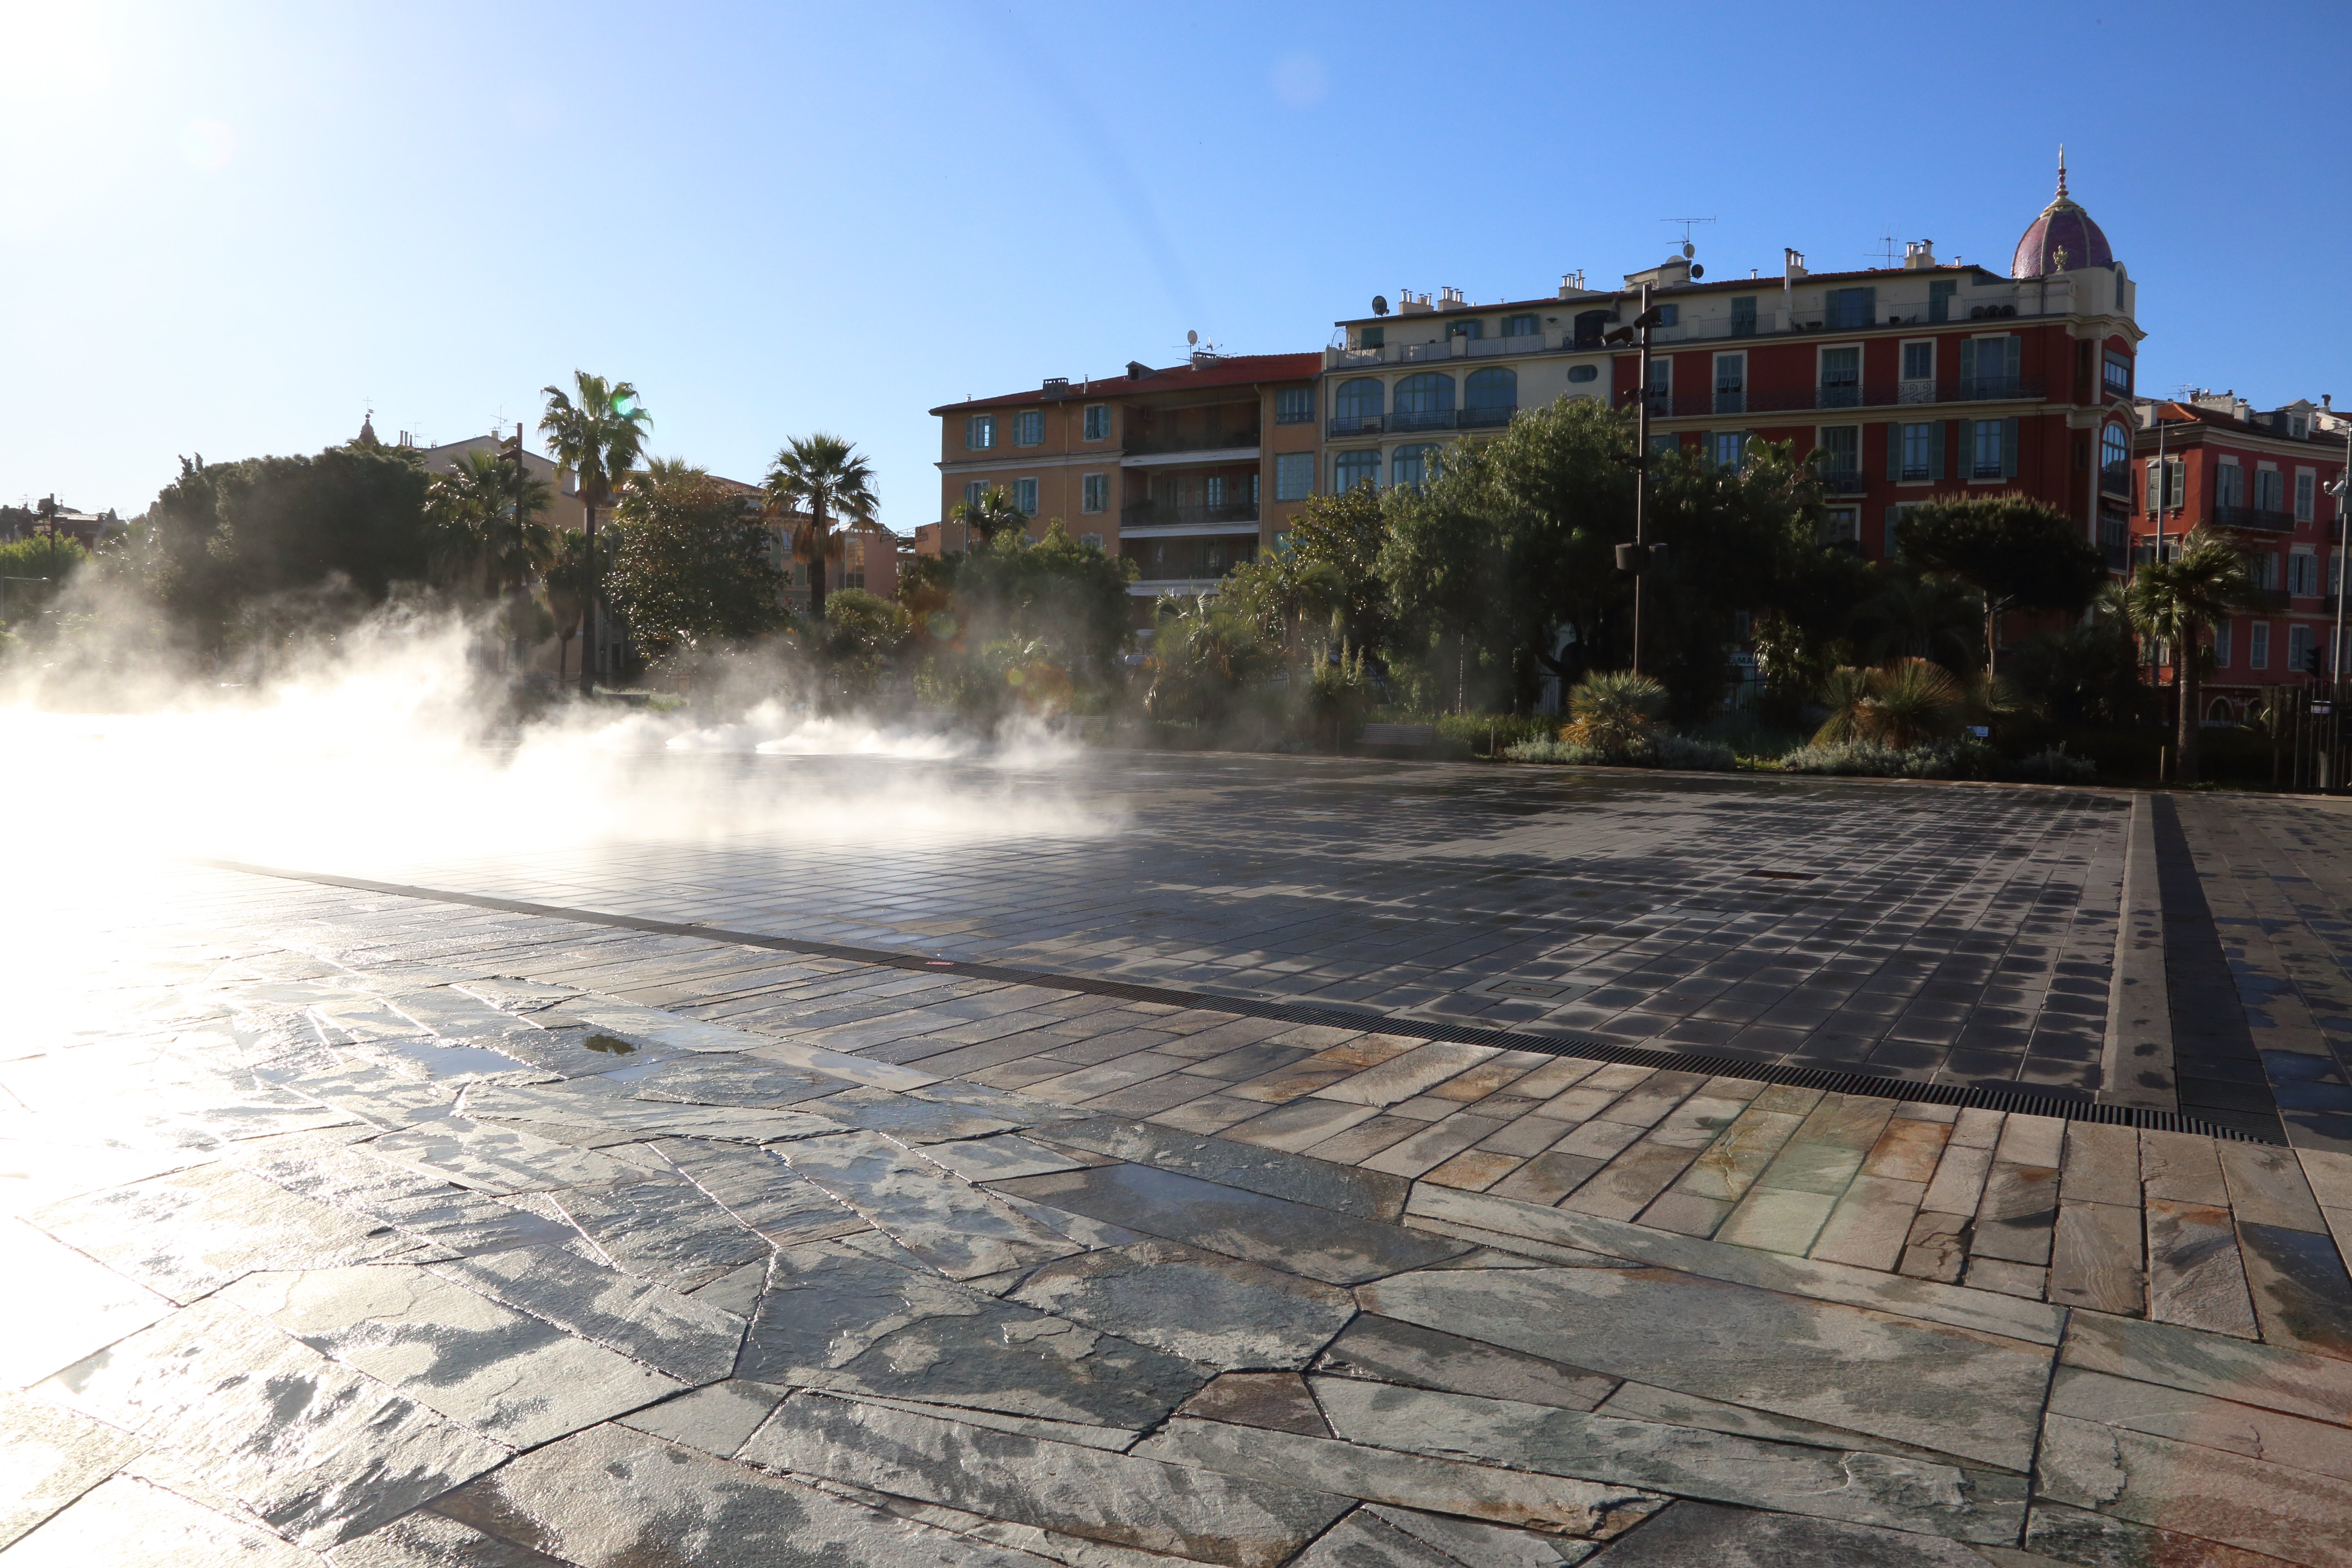
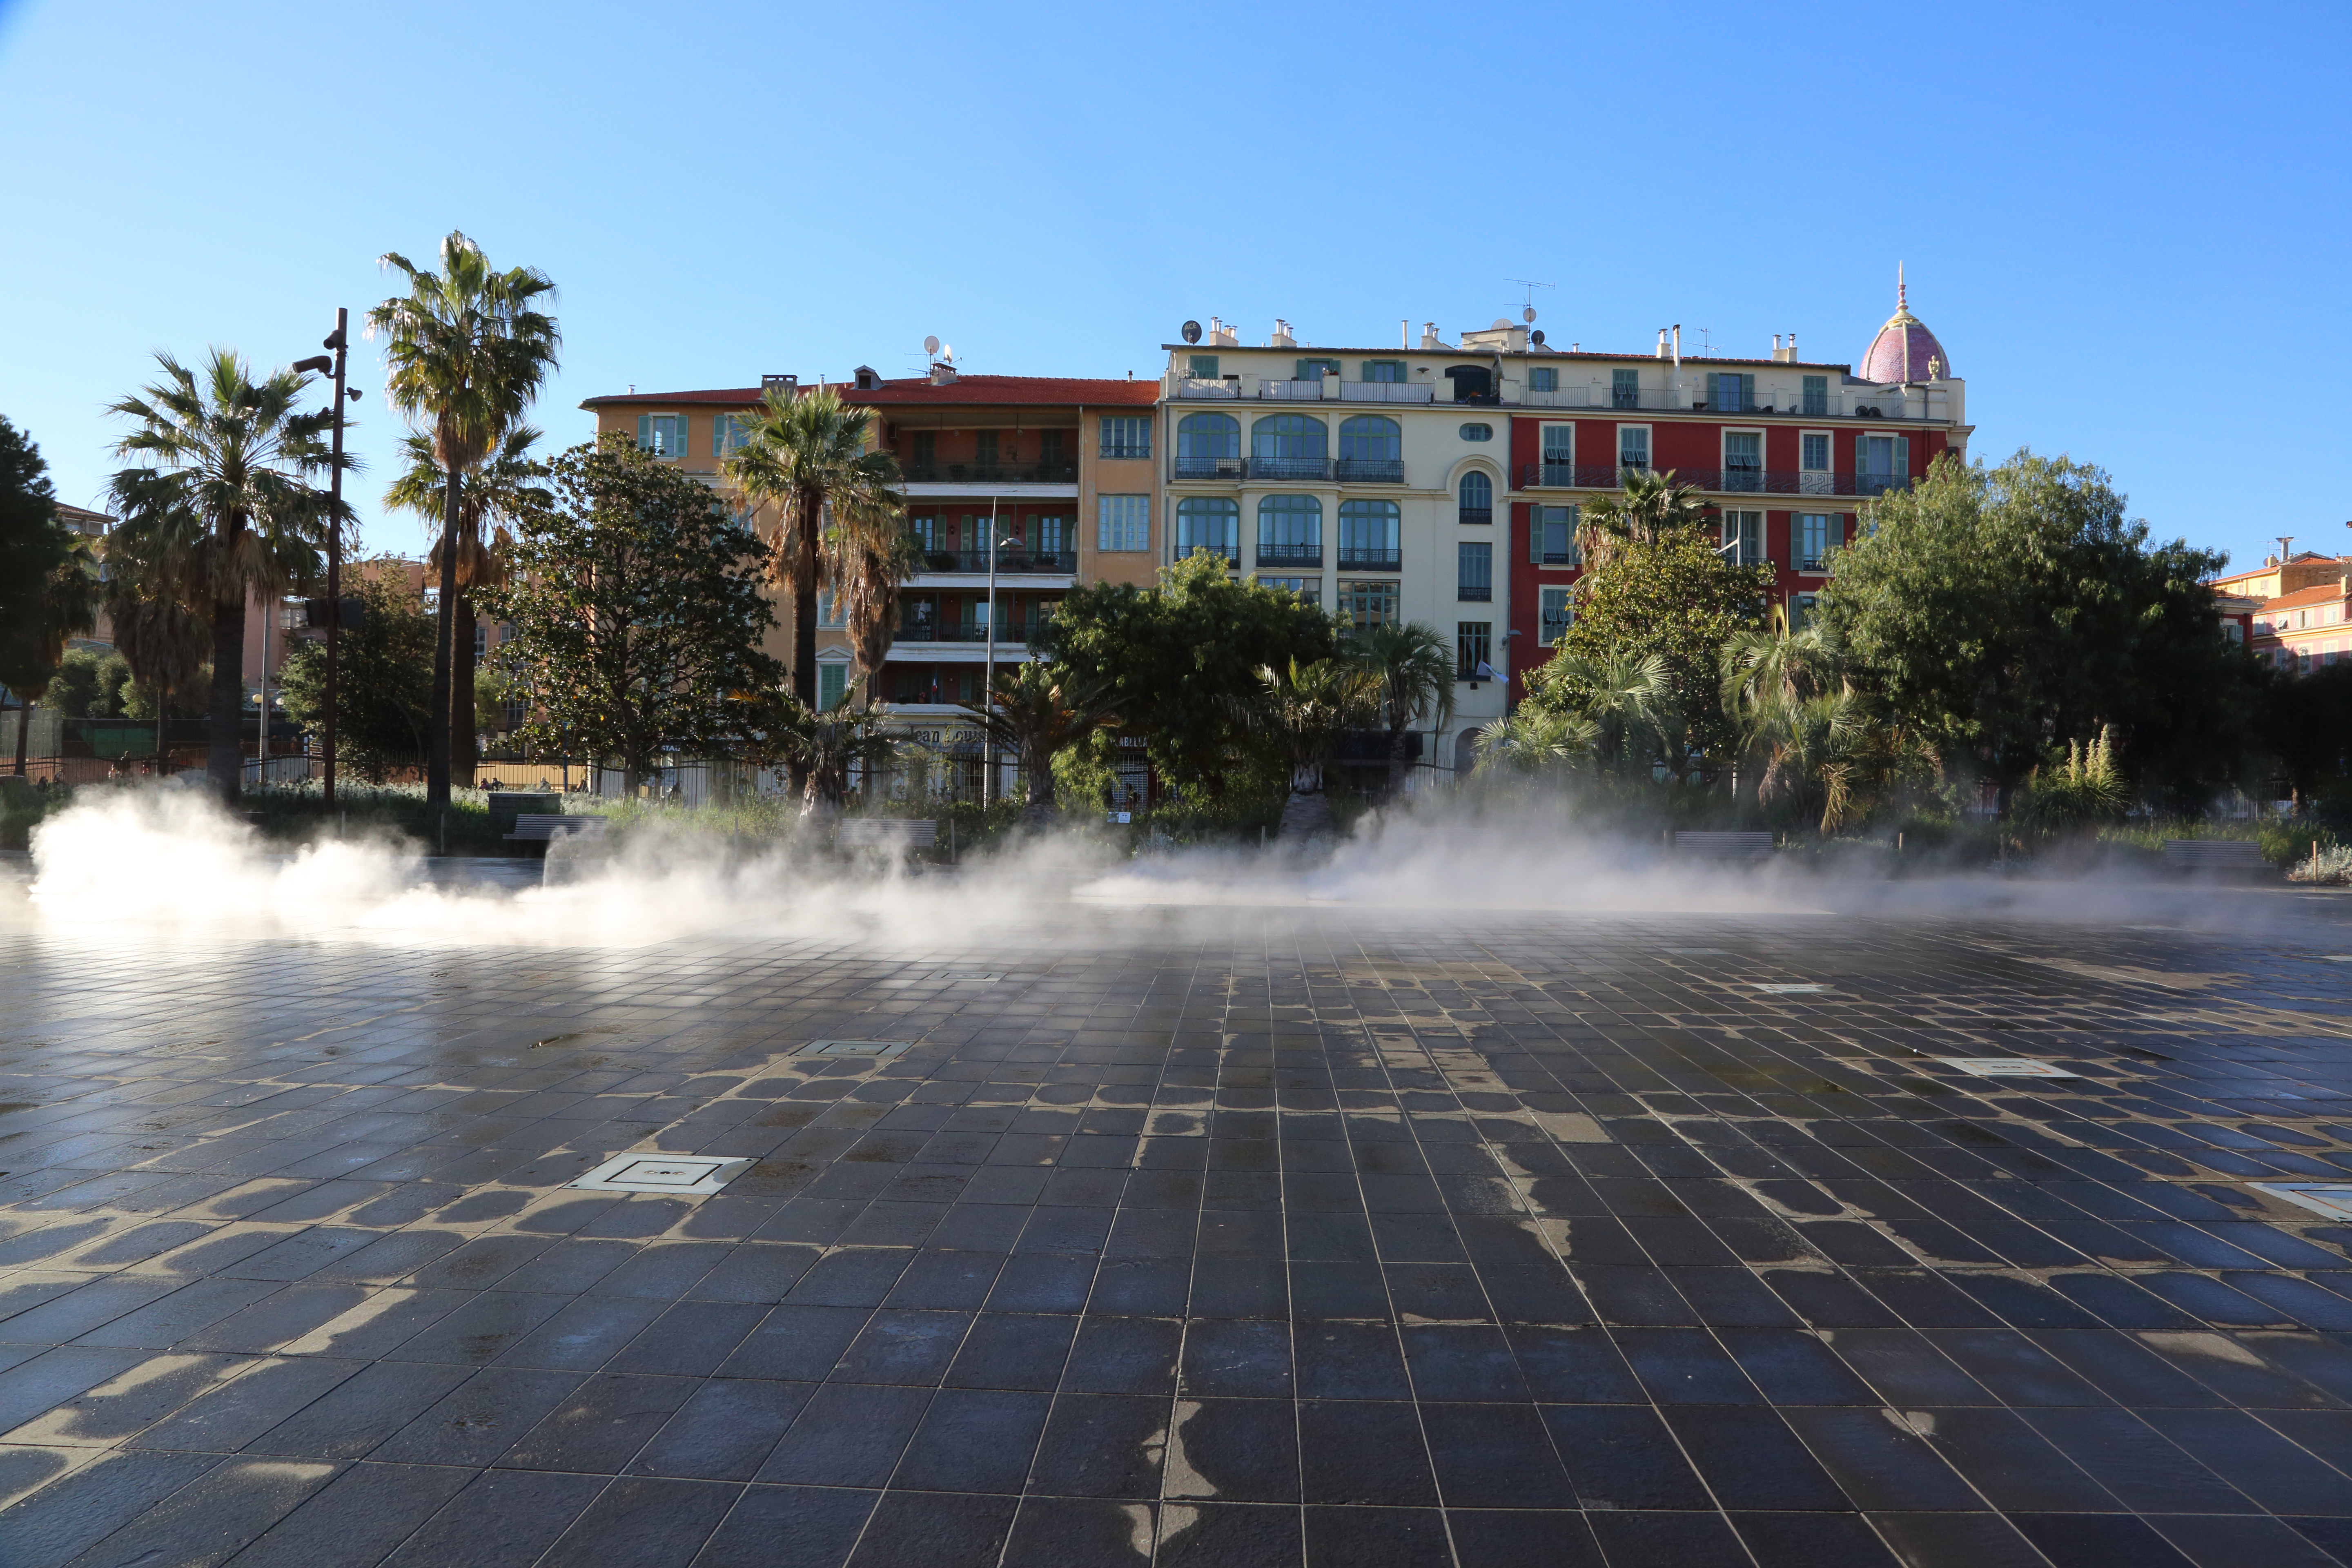
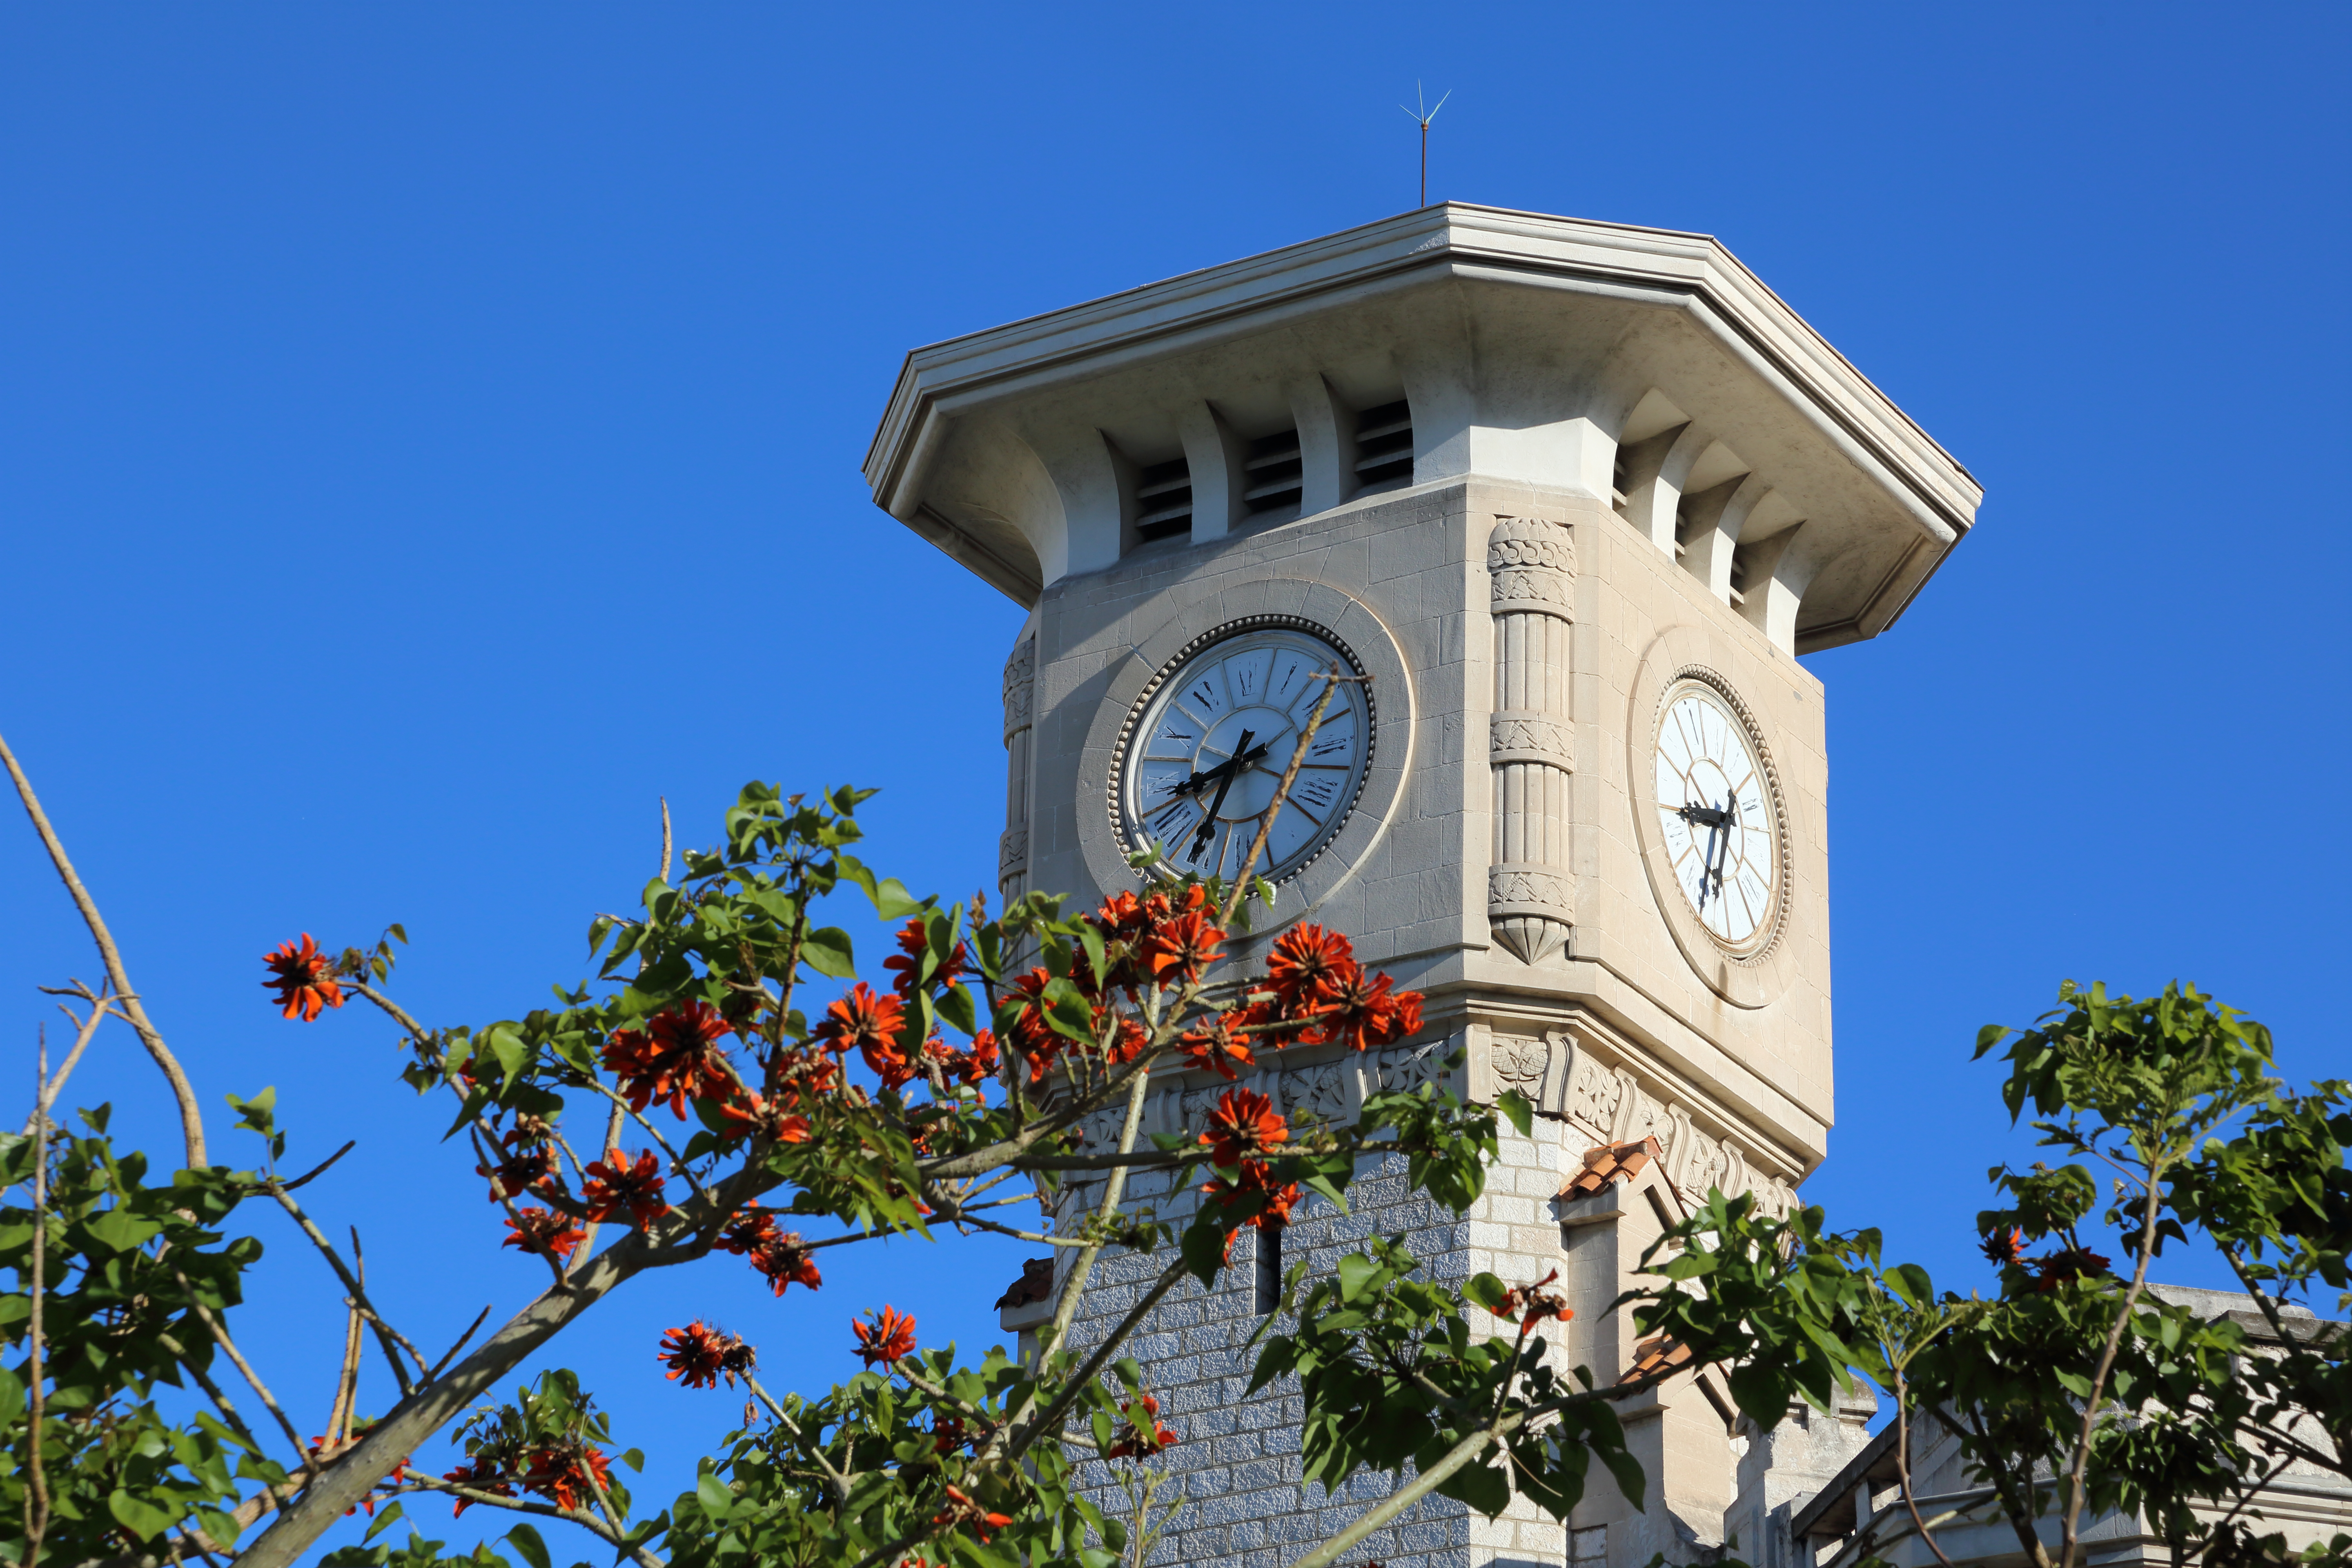
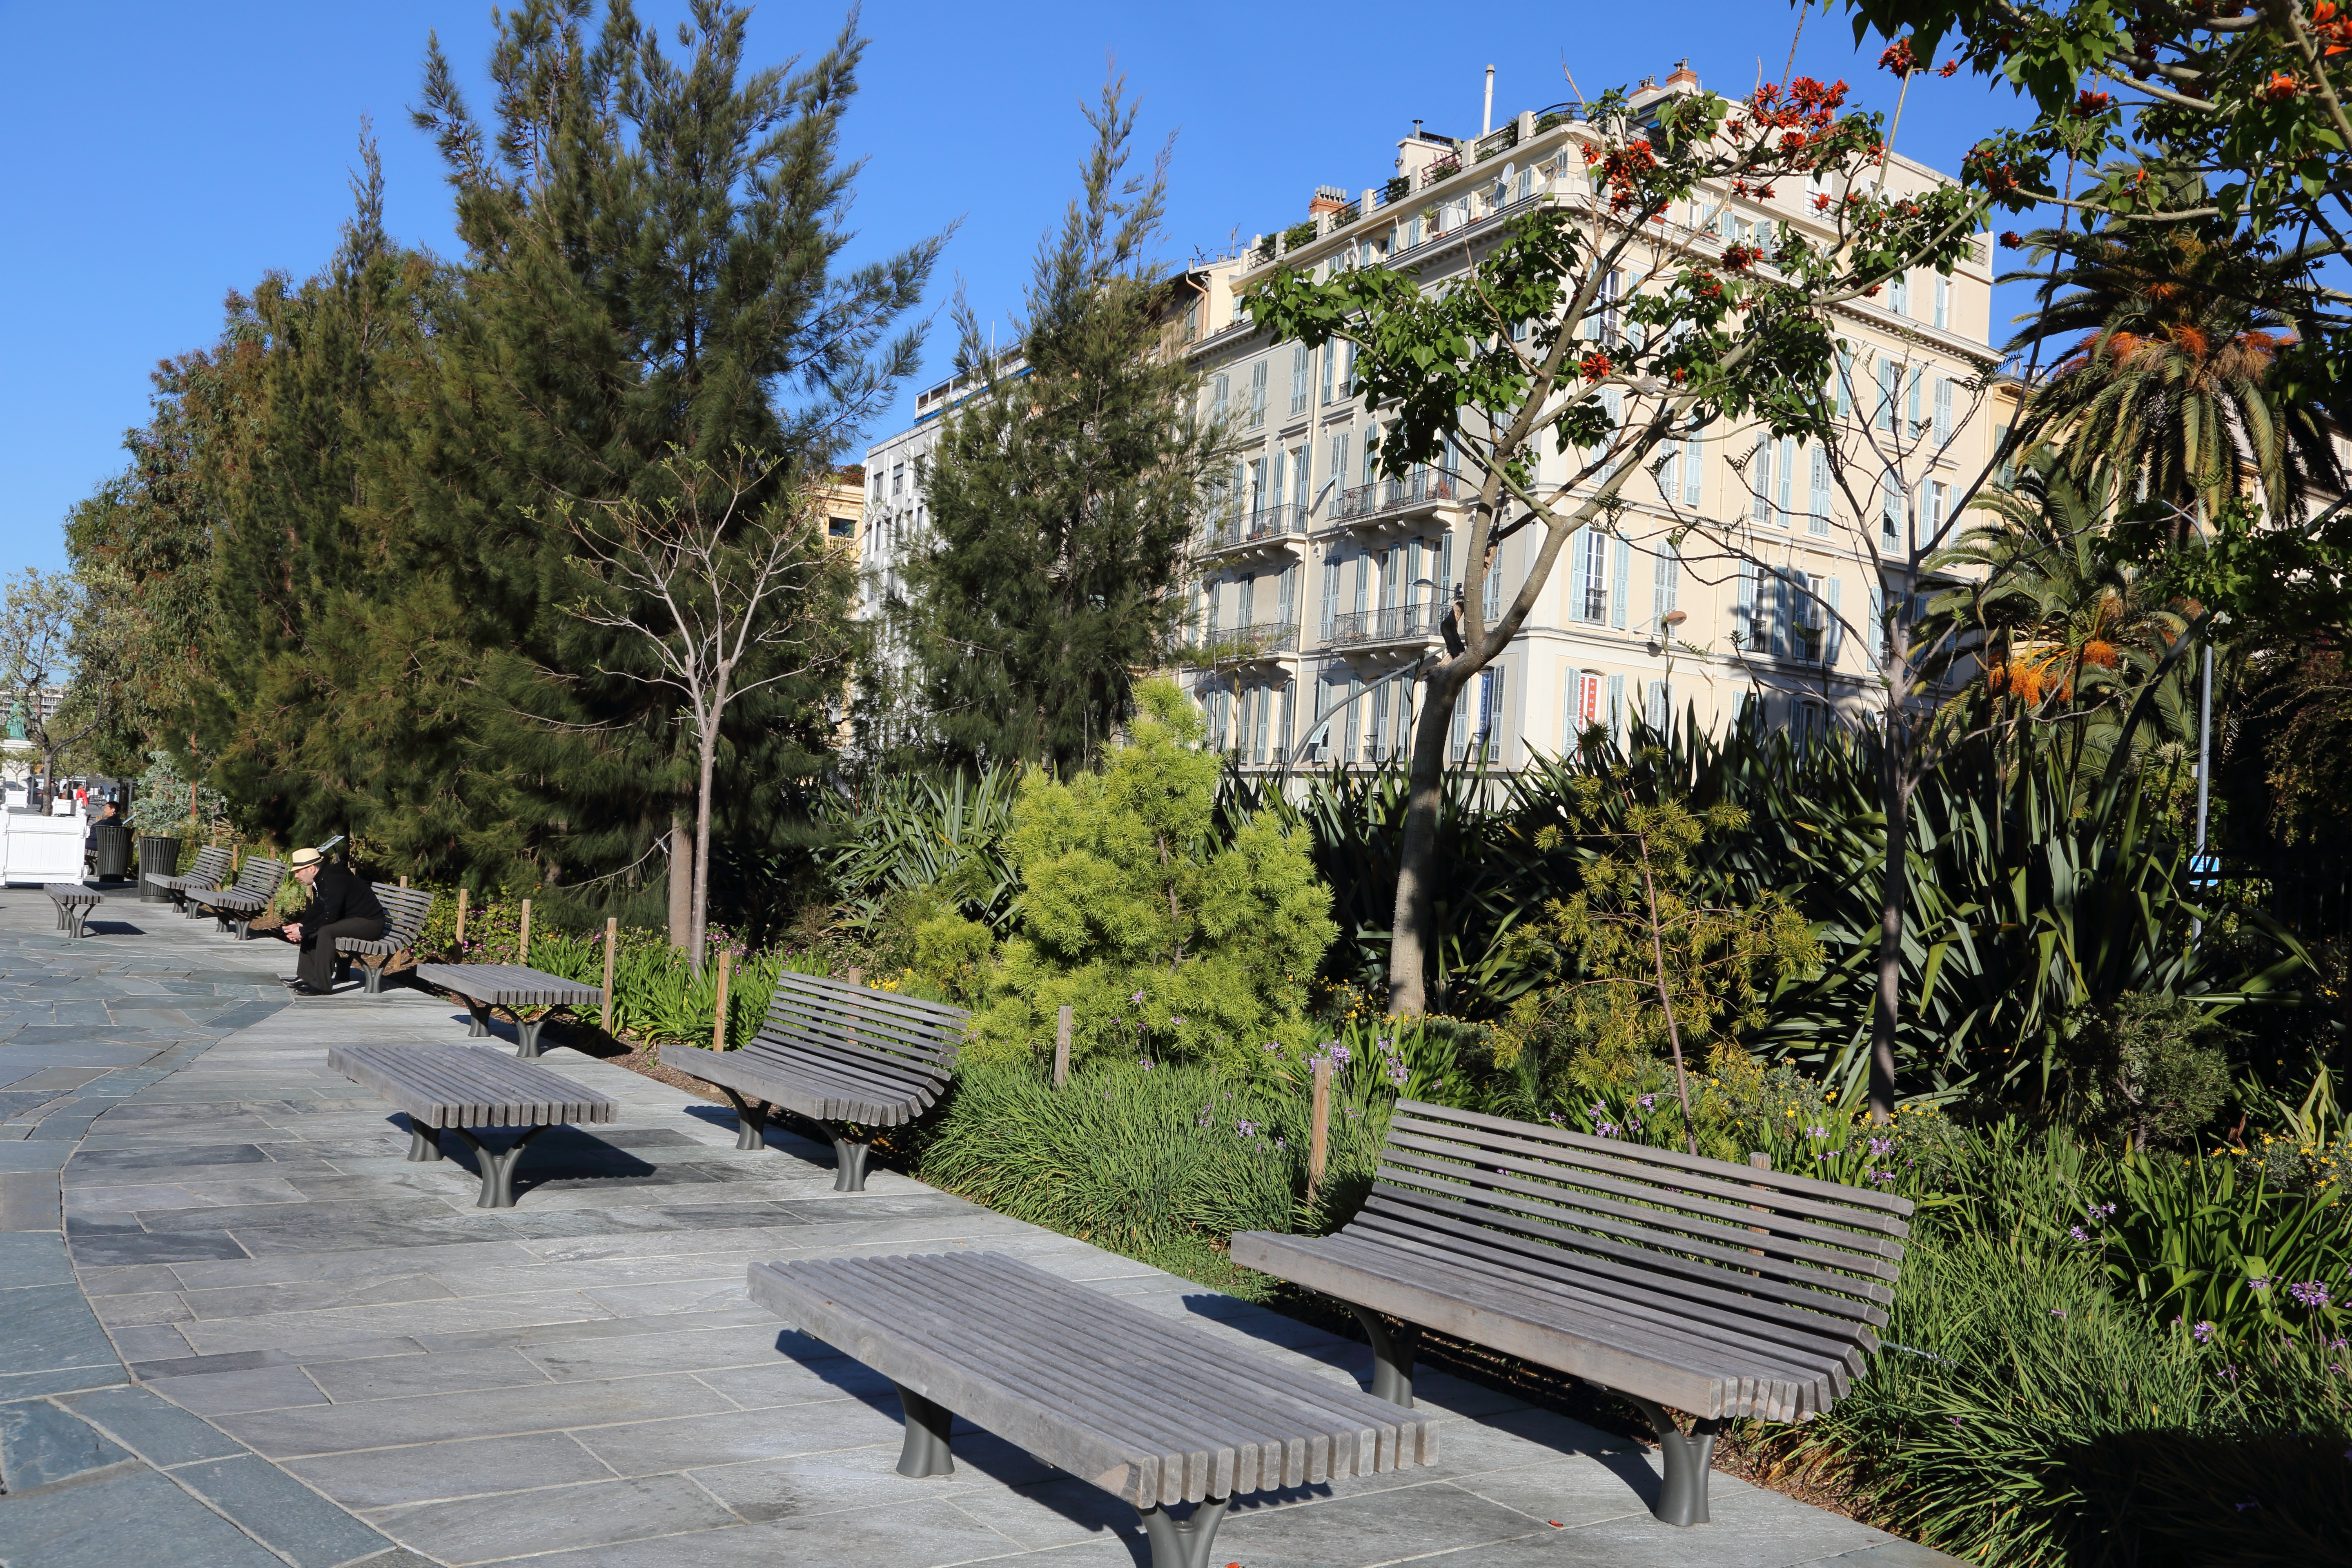
NICE IN SOUTH FRANCE


Light At The End Of The Tunnel


The Kut


PHOTOGRAPHY AFTER A STROKE A FEW THOUGHTS

there does not seem to be much specific advice or comment even so I thought a few words might be interesting for those who find themselves in this unfortunate situation, luckily this is not a job for me but a fairly serious hobby where i try and take my photography to the quality of a professional

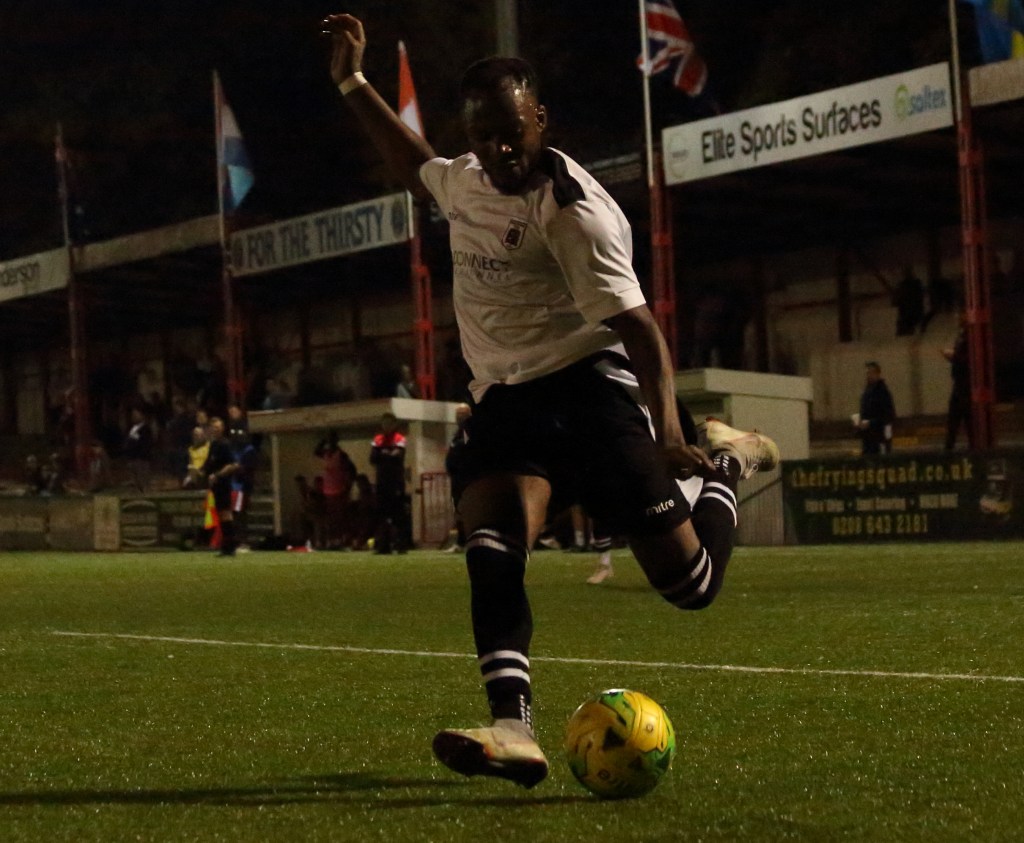
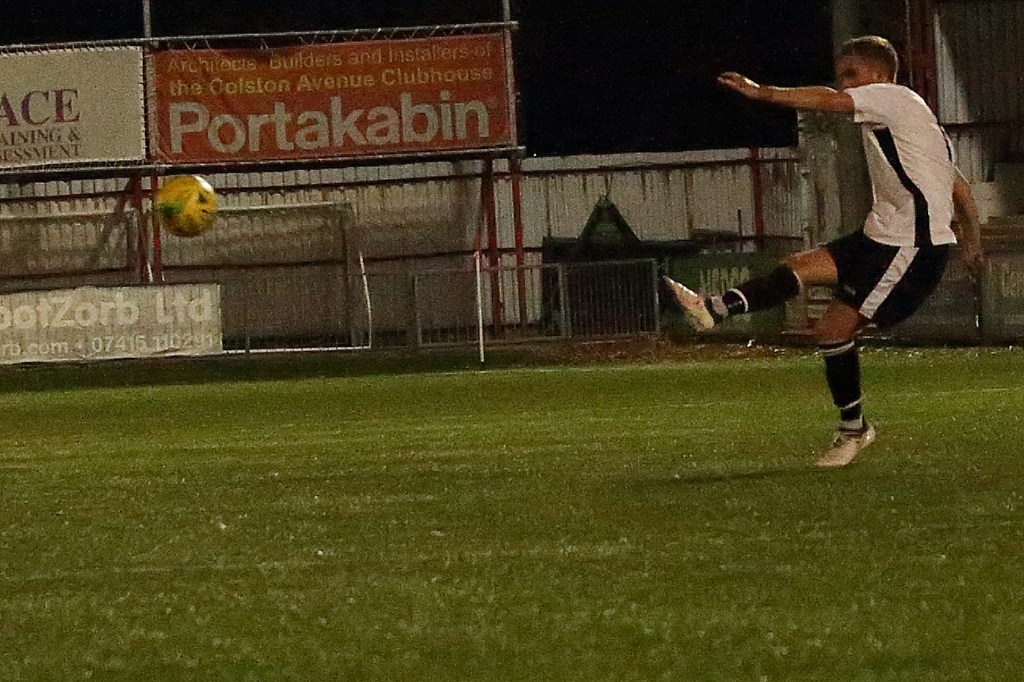
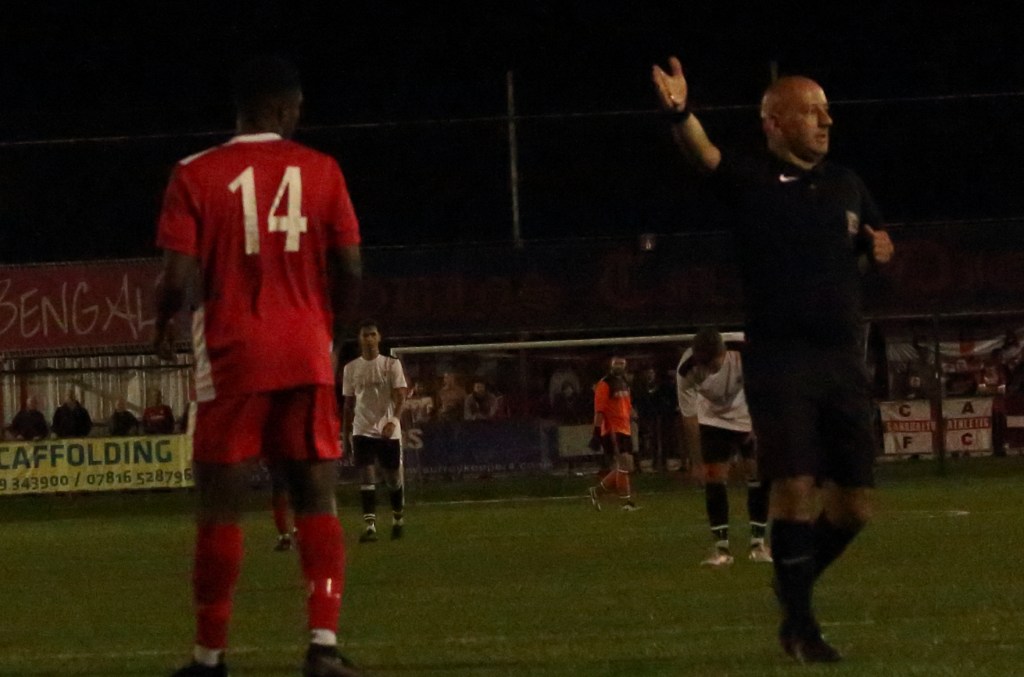
after the shock of a totally unexpected stroke i made my decision to fight and try to get back to my previous perceived level. the biggest challenge would be my sports photography in which the weight of the equipment’s going to be a clear challenge

chrisbushephotography.com

weight challenges– i bought a lighter camera body canon M50 and decided that i would have to use one of my lighter zoom lenses canon 75-300 which is a good lens but not of the standard of 70-200 2.8 or 100-400 and also bought a tamron 14-400

focusing as the stroke left me partially blind ,this required patience and after trying out live view i returned to using viewfinder out of preference another strategy was to take far more shots expecting but not liking the errors

movement being accustomed to moving around a lot this is the biggest challenge having to take all my photos from a wheelchair in one static position

the brain takes a little longer to fathom out the players to follow and potential action areas

but it is all coming together and i will get there while maybe learning new adaptive skills on the way

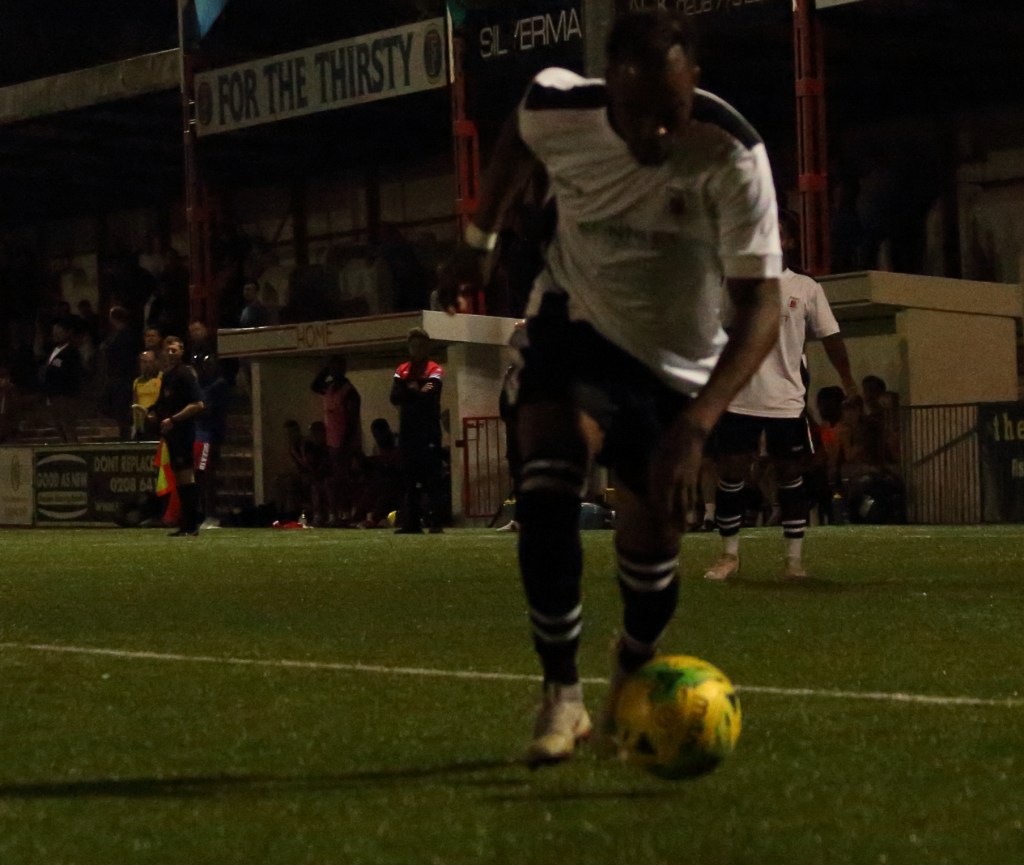
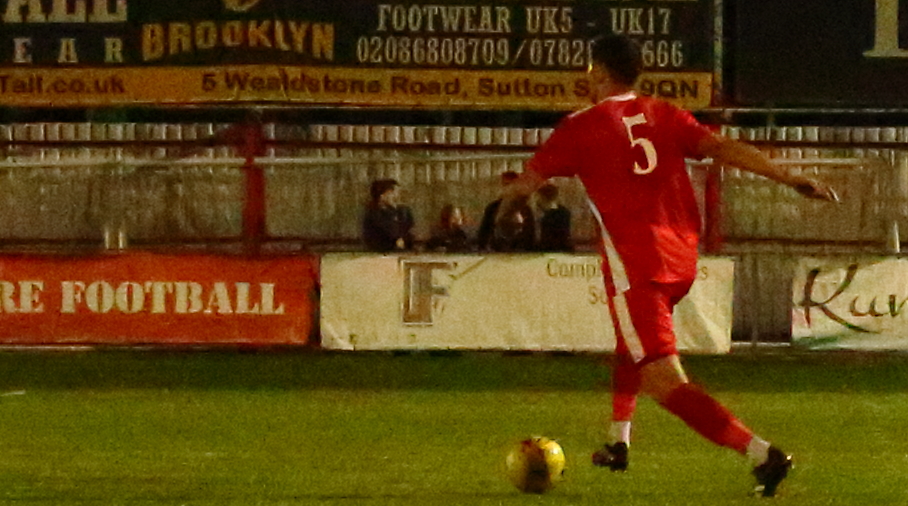
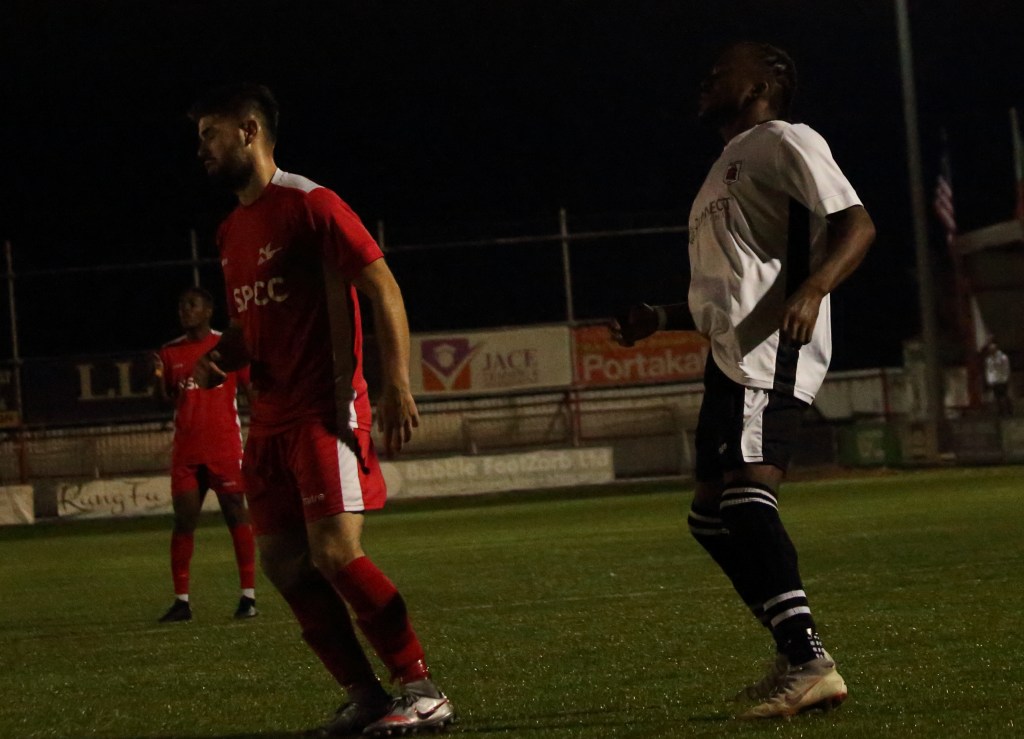
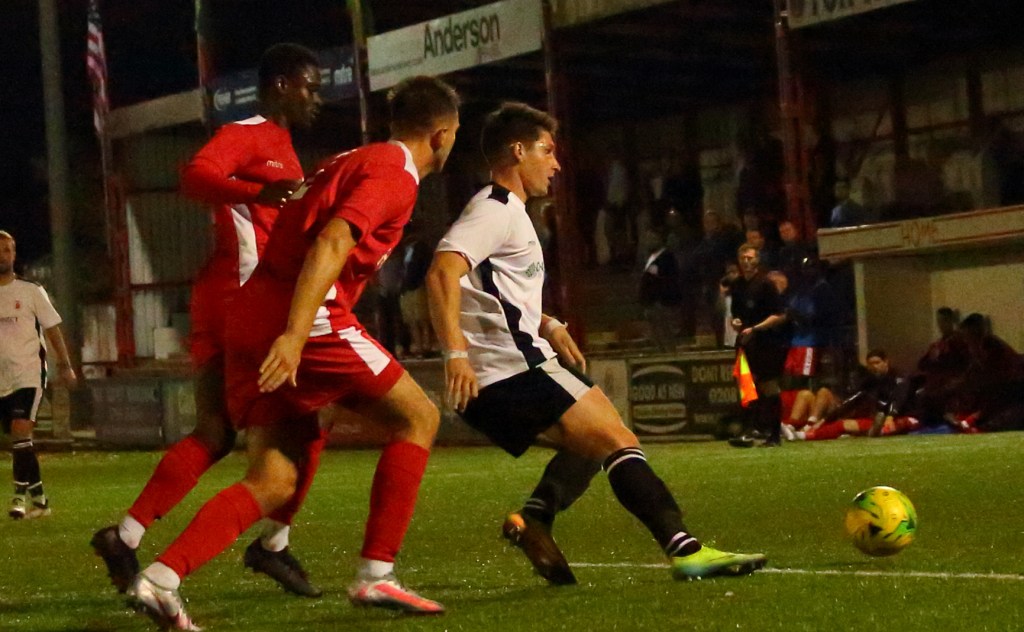
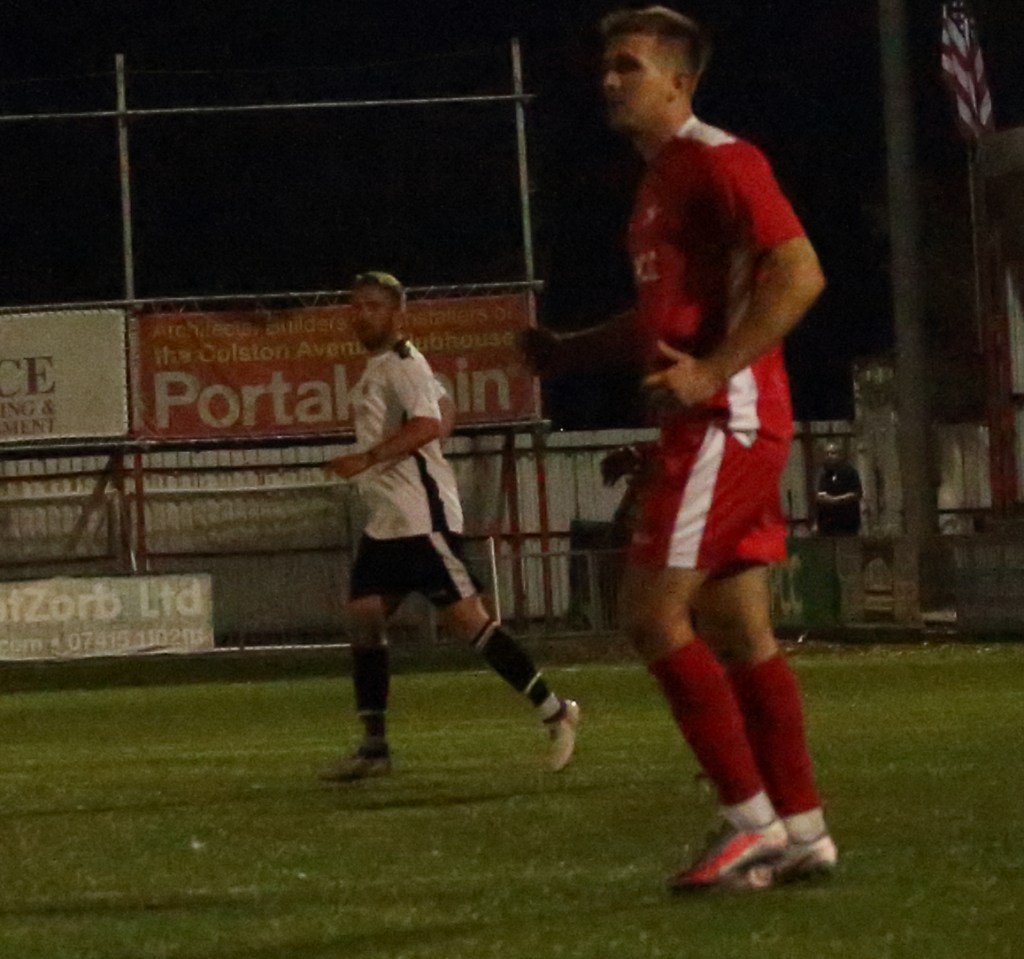
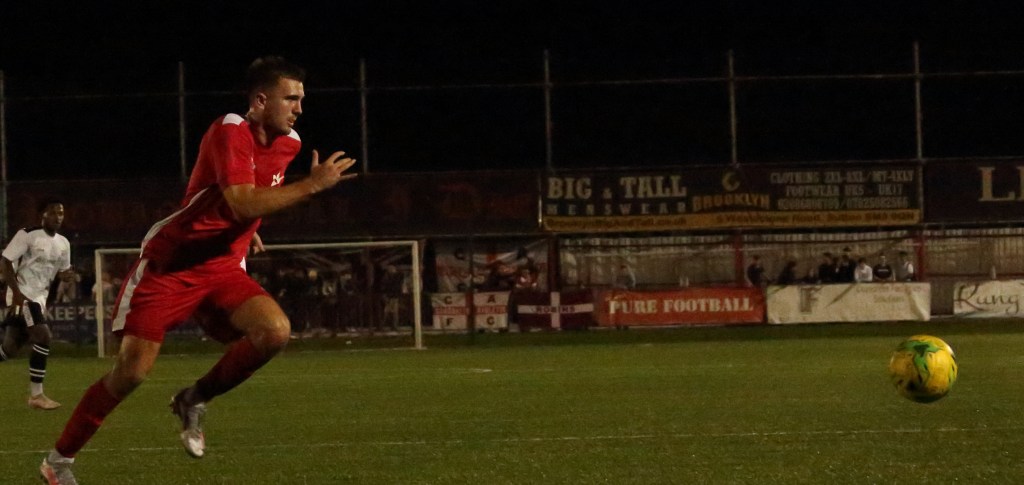
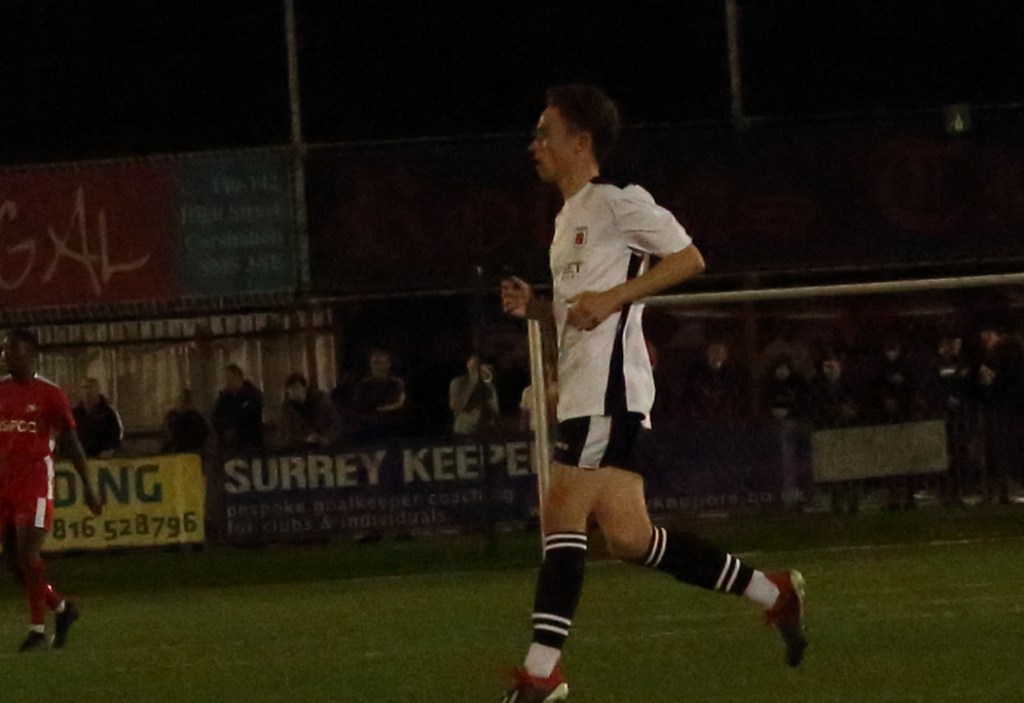
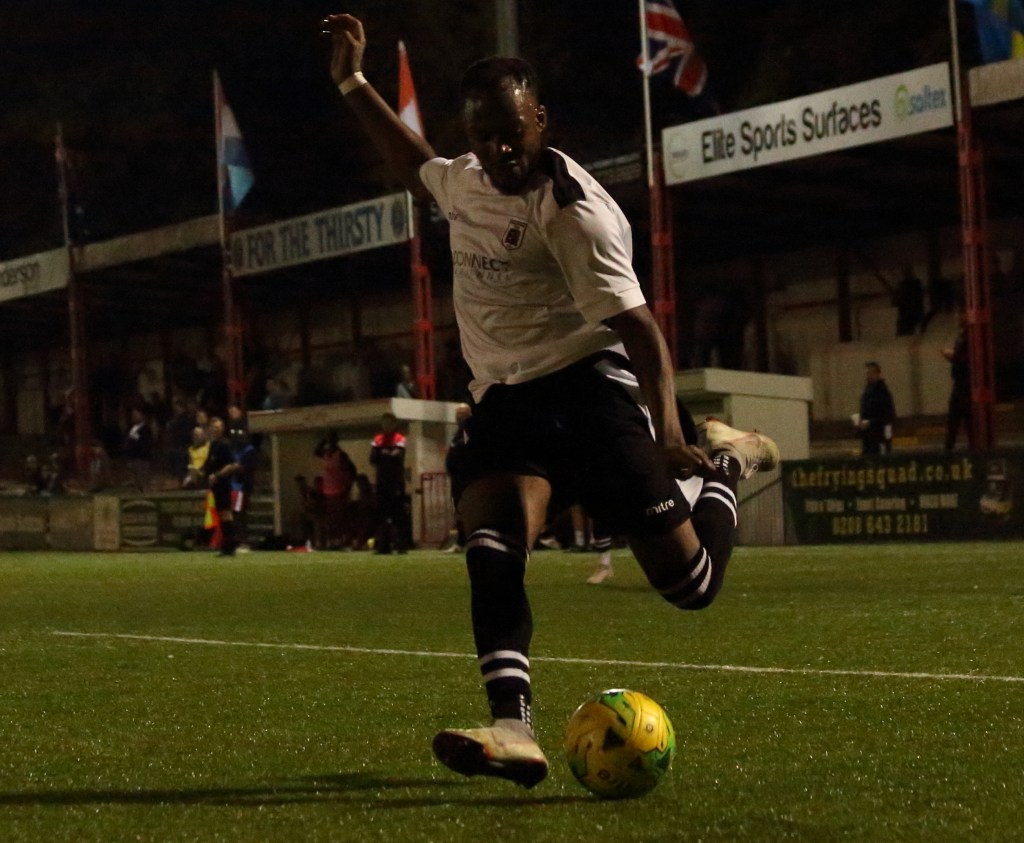
carshalton5 faversham town 0 FAcup photos


The Moon Over Brentford.


the snow leopards of marvell zoo


1K4A2015 copy1K4A20151K4A2015h1K4A20231K4A2027

Kuda Huraa


some factors used by uk government to assess lockdown in covid 19 benefits seem to be imprecise science. More information needed

In the uk folks are starting to become restless with general boredom and lack of social activity . There are daily updates generally from politicians regarding metrics that they consider the public may both want to know and understand hence the focus  here in uk and also Italy and Spain has been on total deaths and hospital admissions; however these may be seriously flawed end points when used to assess a change in the trajectory of for example rate of death.  We see  published that deaths are lower than last week with the presumption made that lockdown and social distancing are the reason for these benefits however there are many  other factors that may alter these rates for which adjusting or normalising data is not or cannot be available. I will blog separately on this later but to give a few examples: we can expect death rates to fall as ITU doctors see more cases and in due course it will be interesting to analyse death rates in an individual  ITU unit over maybe a year I might expect to see falling death rates as doctors get better at treating covid19 patients and send suitable patients to ITU earlier. Similarly, with hospital admissions many factors influence these, the known availability of beds may influence the GP decision to refer for a hospital assessment, increasing knowledge and awareness of covid19 may lead to earlier diagnosis for these and other reasons hospital admissions may vary both in numbers and severity in turn affecting death rates, from observational data collected in uk and worldwide we do know that there are a number of factors associated with higher death rates these include obesity, ethnicity, use of certain medications and although these data derive from large cohorts of patients they are, in research terms, observational data or real world evidence RWE and although these data types carry many benefits including often large numbers they are not designed to prove causality.  Two large studies as an example are E Williamson and Ben Goldacre et al who have studied 17 million NHS adults in uk and a worldwide collaborative group surgisphere that reported data on almost 9000 patients with covid19 from 169 hospitals (MEHRA et al)  in 11 countries, relating to ITU mortality was 24.7% amongst those admitted and 4% in  those not which strongly suggests that  the most severely ill patients are sent to ITU.
in recent weeks there has been much debate over the lack of transparency from the scientific group that advises the government SAGE regarding both their constitution and their advice and what has been reported in the media recently states a shift in metric to measure the efficacy of lockdownusing the R number, The R number is a key factor in gauging the coronavirus pandemic.It refers to the ‘effective reproduction number’ of COVID-19.An R value of 1 is a crucial threshold. The R number signifies the average number of people that one infected person will pass the virus to.


What is reported in the media is that the current R is reported as a range   0.5 -0.9 and values need to be kept below 1 to indicate that a more severe lockdown is not indicated; my original interest in this related to how R could be calculated in the absence of testing for covid19 in the broad population. What I discovered was very interesting ;SAGE gives a range because six different groups of scientists calculate the number based on a variety of data that includes – patients admitted to hospital, critical care bed occupancy, deaths, how much contact there is between people, and so on. As a scientist myself but with no specific knowledge in this area I was a little troubled over the lack of transparency regarding what is the critical metric for UK and the seeming lack of precise detail, nor validation and why the need for six different groups doing the same thing resulting in a range rather than a precise figure


Post Navigation