Arcticterntalk.org
The blog of a travelling psychiatrist and football lover. Who happens to be a halfway decent photographer. Takes a cynical view of the world


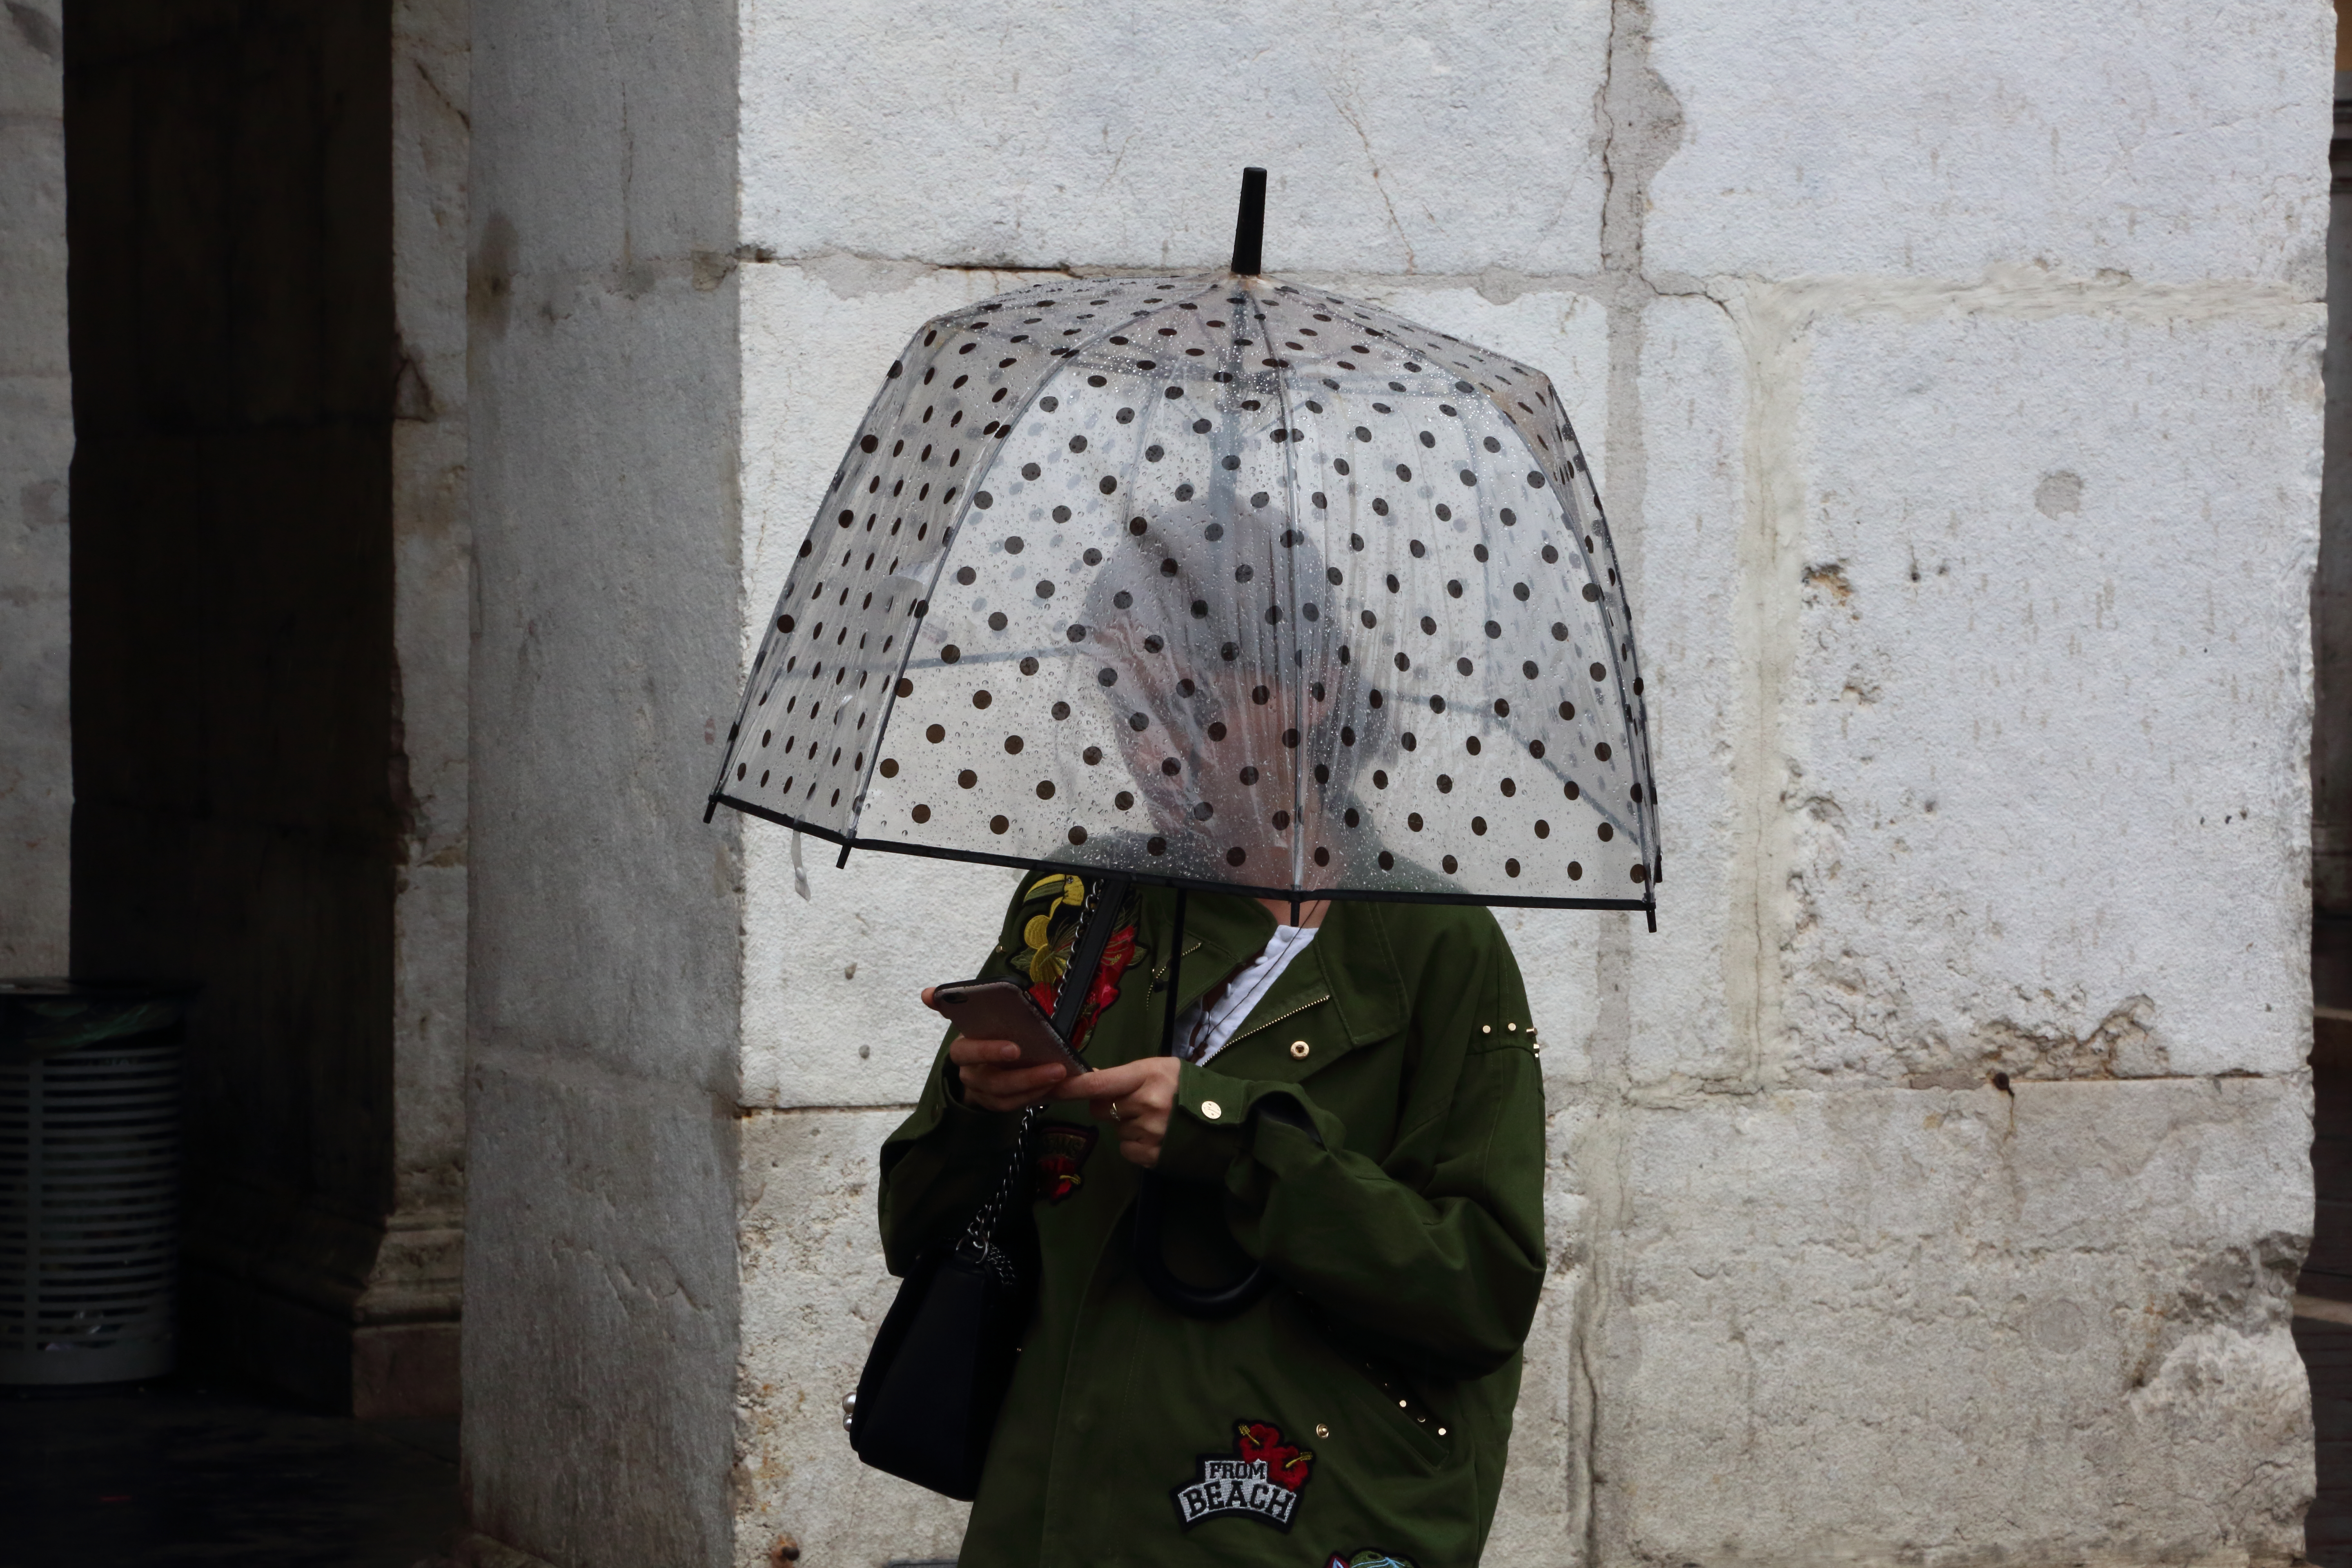


PHOTOGRAPHY AFTER A STROKE A FEW THOUGHTS
there does not seem to be much specific advice or comment even so I thought a few words might be interesting for those who find themselves in this unfortunate situation, luckily this is not a job for me but a fairly serious hobby where i try and take my photography to the quality of a professional
after the shock of a totally unexpected stroke i made my decision to fight and try to get back to my previous perceived level. the biggest challenge would be my sports photography in which the weight of the equipment’s going to be a clear challenge
chrisbushephotography.com
weight challenges– i bought a lighter camera body canon M50 and decided that i would have to use one of my lighter zoom lenses canon 75-300 which is a good lens but not of the standard of 70-200 2.8 or 100-400 and also bought a tamron 14-400
focusing as the stroke left me partially blind ,this required patience and after trying out live view i returned to using viewfinder out of preference another strategy was to take far more shots expecting but not liking the errors
movement being accustomed to moving around a lot this is the biggest challenge having to take all my photos from a wheelchair in one static position
the brain takes a little longer to fathom out the players to follow and potential action areas
but it is all coming together and i will get there while maybe learning new adaptive skills on the way


some factors used by uk government to assess lockdown in covid 19 benefits seem to be imprecise science. More information needed
In the uk folks are starting to become restless with general boredom and lack of social activity . There are daily updates generally from politicians regarding metrics that they consider the public may both want to know and understand hence the focus here in uk and also Italy and Spain has been on total deaths and hospital admissions; however these may be seriously flawed end points when used to assess a change in the trajectory of for example rate of death. We see published that deaths are lower than last week with the presumption made that lockdown and social distancing are the reason for these benefits however there are many other factors that may alter these rates for which adjusting or normalising data is not or cannot be available. I will blog separately on this later but to give a few examples: we can expect death rates to fall as ITU doctors see more cases and in due course it will be interesting to analyse death rates in an individual ITU unit over maybe a year I might expect to see falling death rates as doctors get better at treating covid19 patients and send suitable patients to ITU earlier. Similarly, with hospital admissions many factors influence these, the known availability of beds may influence the GP decision to refer for a hospital assessment, increasing knowledge and awareness of covid19 may lead to earlier diagnosis for these and other reasons hospital admissions may vary both in numbers and severity in turn affecting death rates, from observational data collected in uk and worldwide we do know that there are a number of factors associated with higher death rates these include obesity, ethnicity, use of certain medications and although these data derive from large cohorts of patients they are, in research terms, observational data or real world evidence RWE and although these data types carry many benefits including often large numbers they are not designed to prove causality. Two large studies as an example are E Williamson and Ben Goldacre et al who have studied 17 million NHS adults in uk and a worldwide collaborative group surgisphere that reported data on almost 9000 patients with covid19 from 169 hospitals (MEHRA et al) in 11 countries, relating to ITU mortality was 24.7% amongst those admitted and 4% in those not which strongly suggests that the most severely ill patients are sent to ITU.
in recent weeks there has been much debate over the lack of transparency from the scientific group that advises the government SAGE regarding both their constitution and their advice and what has been reported in the media recently states a shift in metric to measure the efficacy of lockdownusing the R number, The R number is a key factor in gauging the coronavirus pandemic.It refers to the ‘effective reproduction number’ of COVID-19.An R value of 1 is a crucial threshold. The R number signifies the average number of people that one infected person will pass the virus to.
What is reported in the media is that the current R is reported as a range 0.5 -0.9 and values need to be kept below 1 to indicate that a more severe lockdown is not indicated; my original interest in this related to how R could be calculated in the absence of testing for covid19 in the broad population. What I discovered was very interesting ;SAGE gives a range because six different groups of scientists calculate the number based on a variety of data that includes – patients admitted to hospital, critical care bed occupancy, deaths, how much contact there is between people, and so on. As a scientist myself but with no specific knowledge in this area I was a little troubled over the lack of transparency regarding what is the critical metric for UK and the seeming lack of precise detail, nor validation and why the need for six different groups doing the same thing resulting in a range rather than a precise figure
CLINICAL DETERMINANTS FOR DECISION MAKING WITH COVID 19-are complex and death rate change may not be robust enough
AS A CLINICIAN ALTHOUGH CERTAINLY NOT AN EPIDEMIOLOGIST I HAVE FOLLOWED WITH GREAT INTEREST THE COVID19 STORY WAITING TO LEARN THE BASISand metrics UPON WHICH LOCKDOWN WAS INSTIGATED, AND THOSE THAT WILL DETERMINE THE RELEASE OF LOCKDOWN UNFORTUNATELY THE SCIENTIFIC GROUP THAT ADVISES THE GOVERNMENT SAGE MEETS IN sECRET AND THERE Have BEEN MANY CALLS FOR TRANSPARENCYOVER HOW DECISIONS ARE MADE, WHAT FILTERS DOWN TO THE MEDIA AND THE GENERAL PUBLIC SEEMS TO SUGGEST THAT DEATH RATES AND HOSPITAL ADMISSIONS and the dreaded R number ARE AMONGST THE MOST CRITICAL AND DETERMINING ENDPOINTS however as reported in the sunday times may 3rd sir david king previous chief scientific adviser to governments is convening an independent scientific group that will have total transparency so we may in future indeed understand the endpoints and the metrics utilised for determining these complex issues around lockdown
to summarise lockdown has such important societal short and long term effects and consequencesthat my presumption swas that surely to initiate lockdown the most relevant metric must have been chosen that not only would determinen when lockdown should be initiated but to gauge the success of any action perhaps also determining when such actions could be stopped hence reversing lockdown, at the same time appreciating that for everyone this is a learning curve,
choosing any metric was never going to be an easy task thankfully our learnings from such pandemics are not so often.andthe options seem to be as reported in the mediator include
- the R NUMBER, I HAVE ARGUED THAT THIS FoR THE PURPOSESABOVE IN A SEPARATE ARTICLEthe r number REPRESENTS IMPRECISE SCIENCE AND CANNOT BE USED IN ISOLATIONAS WITHOUT A COUNTRYWIDE SCREENING AND DIAGNOSING PROGamme we have no idea how many people are infected with covid19so cannot begin to determine infectivitynor the benefits of any lockdown action.we are not privy to the thinkings of SAGE BUT as they it seems have determined not a single numberfor R but a range 0.5-0.9 from six separate groups of scientists one might argue they must have reached similar conclusions
- death rates which although looking a simple enough metrivwhere one might determine the need for lockdown and equally when lockdown can be judged to have been successful is actually a complex metric as so many other factors influence death rates making it hard if not impossible to ascribe any change to lockdownor in fact any single change
- 3HOSPITAL ADMISSION RATES.AGAIN SO MANY FACTORS INFLENCE THISMOST NOTABLY BED AVAILABILITY, NUMBERS OF REFERRALS NUMBERS OF DIAGNOSED CASES,STAFF NUMBERS NONE OF WHICH REMSIN CONSTANT
what factors influence death rates?although somewhere in my hundred or so publications am on record as saying that mortality is one of the few clinical endpoints not invented by academia or the pharmaceutical industry so to make clear I am a fan of this endpoint when used critically, in fact usage of any single endpoint here is fraught with difficulty especially when we are following the trajectory of that endpointas all sorts of changes to clinical care happen as knowledge spreads little remains constant When even a small change runs the risk ofoverinterpretation and judgement of success or failure of an action such as lockdown hence the ability to tease out the changes due to lockdown are critical
what aresome of the specific problems with using death rates.firstly ensuring that all deaths are collected,in the relevant population especially if we wish to compare with other countries or between regions.secondlythe plethora of factors influencing death rates that themselves alter over time severity of illness is an obvious factorthis itself will not remain constant we must examine the criteria for hospital admission,alters numbers of available beds, criteria for ITU admission, improvements in treating covid19as knowledge increases units will become not only better at treating but MORE RAPID in transferring to ITU, AVAILABILITY OF BEDS, VENTILATORS ,severity of illness at presentation,stage of itu transfer, ,all these criteria and more have huge impact on death rates and also criteria for both hospital admission thus if we are looking at rate of changein death rates as a key metric to determine removal of lockdown it is far more complicated to ascribe value of lockdowns the other factors do not remain constant for example the greater education about covid19 changes netricsand is likely to lead to greater and earlier hospital admission which in turn might reduce death rates testing is likely to increase case numbers potentially increasing hospital admission rates.
i a writher is a riskwhere even a small change einhich even a small when even a small changers the risk of misinterpreting success or failure of an action
,
r asythe severity of illness clearly predicts deaths some critical deterrent observational dataminants of risk of death include criteria for hospital admission,severity of illness at presentation,stage of its transfer, sooner or later, expertise of the hospital and its, it can be predicted thatvwith grecaterpatient numbers will come better expertise,all these criteria and more have huge impact on death ratesthe rates collected completely?it is only recently that non hospital deaths have been included secondly there are many factors inflrnving death ratesfirstly are the data even collected completelyrstly to be certain that all deaths are collected things got off to a bad start when initial statistics failed to include care home deaths ,w
- in summary although3 hospital admission rates and death rates look solid endpoints and for large populations over long periods of time they may be when adjusted fotthe increasing numbers of factors that may include (ethnicity, , age sex BMIi other comorbid illnessetc and a number of other deterninants postulated by large volumes of observational research, in the shorter term however we if we are using trajectory or rate of change over a relatively short time ass our determinant of whether lockdown should stop or proceed to a further stage there are so many other determinants that are unlikely to remain constant that could lead to changes in death rates or hospital admission rates so to ascribe any changes in these rates to a success in lockdown might be premature or wrong this is a complex equation far beyond for example what any surd` can determine
and whilst the excellent observational data continues to add knowledge we also need to learn what additional metrics should be collected as these data need to come from observational research (often known as rweREAL WORLD EVIDENCE) rather thanRCTsand as in other illnessesses such as rheumatoid arthritis, itisthe time to initial diagnosis and then hospital admission and transfer to ITUthat MAY BE CRITICAL maybe somethese measures can be collected from ongoing projects as these use electronic patient records for example ben gol acre;s OXFORDProject has access to 17 million NHS adults in uk(1) and the surgishere group of 169 hospitals in 11 countries (2reported on 9000 patients similarly using electronic records endpoints worth considering include
- evaluation of large singleITU,S DO THE DEATH AND OUTCOME RATES IMPROVE OVER TIME AS THE CLINICIANS BECOME MORE ADEPT AT TREATING PATIENTS WITH COVID19OVER TIME AND WHAT CHANGES
- in conclusion i have every sympathy with a government trying to establish a single metric that might explain to the general population how matters are progressing with this pandemic however they run the risk by over simplifying complex endpointsand over promising here what might help everyone would be greater transparency over the decisions made by SAGE,
.
A Great Place
The rants and warblings of an active and some would say disturbed mind. A Brentford Fc supporter and a psychiatrist and photographer. Welcome to my musings and rants.
